WORLD FLUX DATA SET 2016 AND REPORT (currently in review):
Access the World Flux Data Set 2016. Check back for manuscript currently in review.
Coming Soon!
a Global Synthesis and Critique of Estuarine and Coastal Data.
CHESAPEAKE BAY SEDIMENT WATER FLUX
DATABASE AND REPORT:
Access the Database (revised 18-Sept-2008). Check back for more recent updates!
Read the report: Sediment Oxygen and Nutrient Exchange Measurements from Chesapeake Bay, Tributary Rivers and Maryland Coastal Bays: Development of a Comprehensive Database & Analysis Factors Controlling Patterns and Magnitude of Sediment-Water Exchanges.
Patuxent River Estuary Historical Data Set Collected by Cory and Associates (1963-1969)
During the early 1960s the Chesapeake Biological Laboratory (then a part of the Maryland Natural Resources Institute) established a field station at Hallowing Point, adjacent to the MD Route 231 Bridge near Benedict, MD. One of the primary motivations for establishing this research facility was to investigate effects of the steam electric generating station (Chalk Point Power Plant) on the ecology of the Patuxent estuary, especially in the near-field estuary adjacent to the discharge plume of the “once-through” cooling water system. Studies at this location, under the direction of Dr. Joseph A. Mihursky, began in 1962 and the facility was active until the fall of 1977 (Figure 1). The use of estuarine water for cooling condenser systems was a novel application at the time and there were those in the engineering community who believed that the corrosive nature of sea water would lead to insurmountable problems and the approach would fail. However, the approach, with multiple modifications to the heat exchange system, proved successful and the power plant has been expanded and is still in operation.
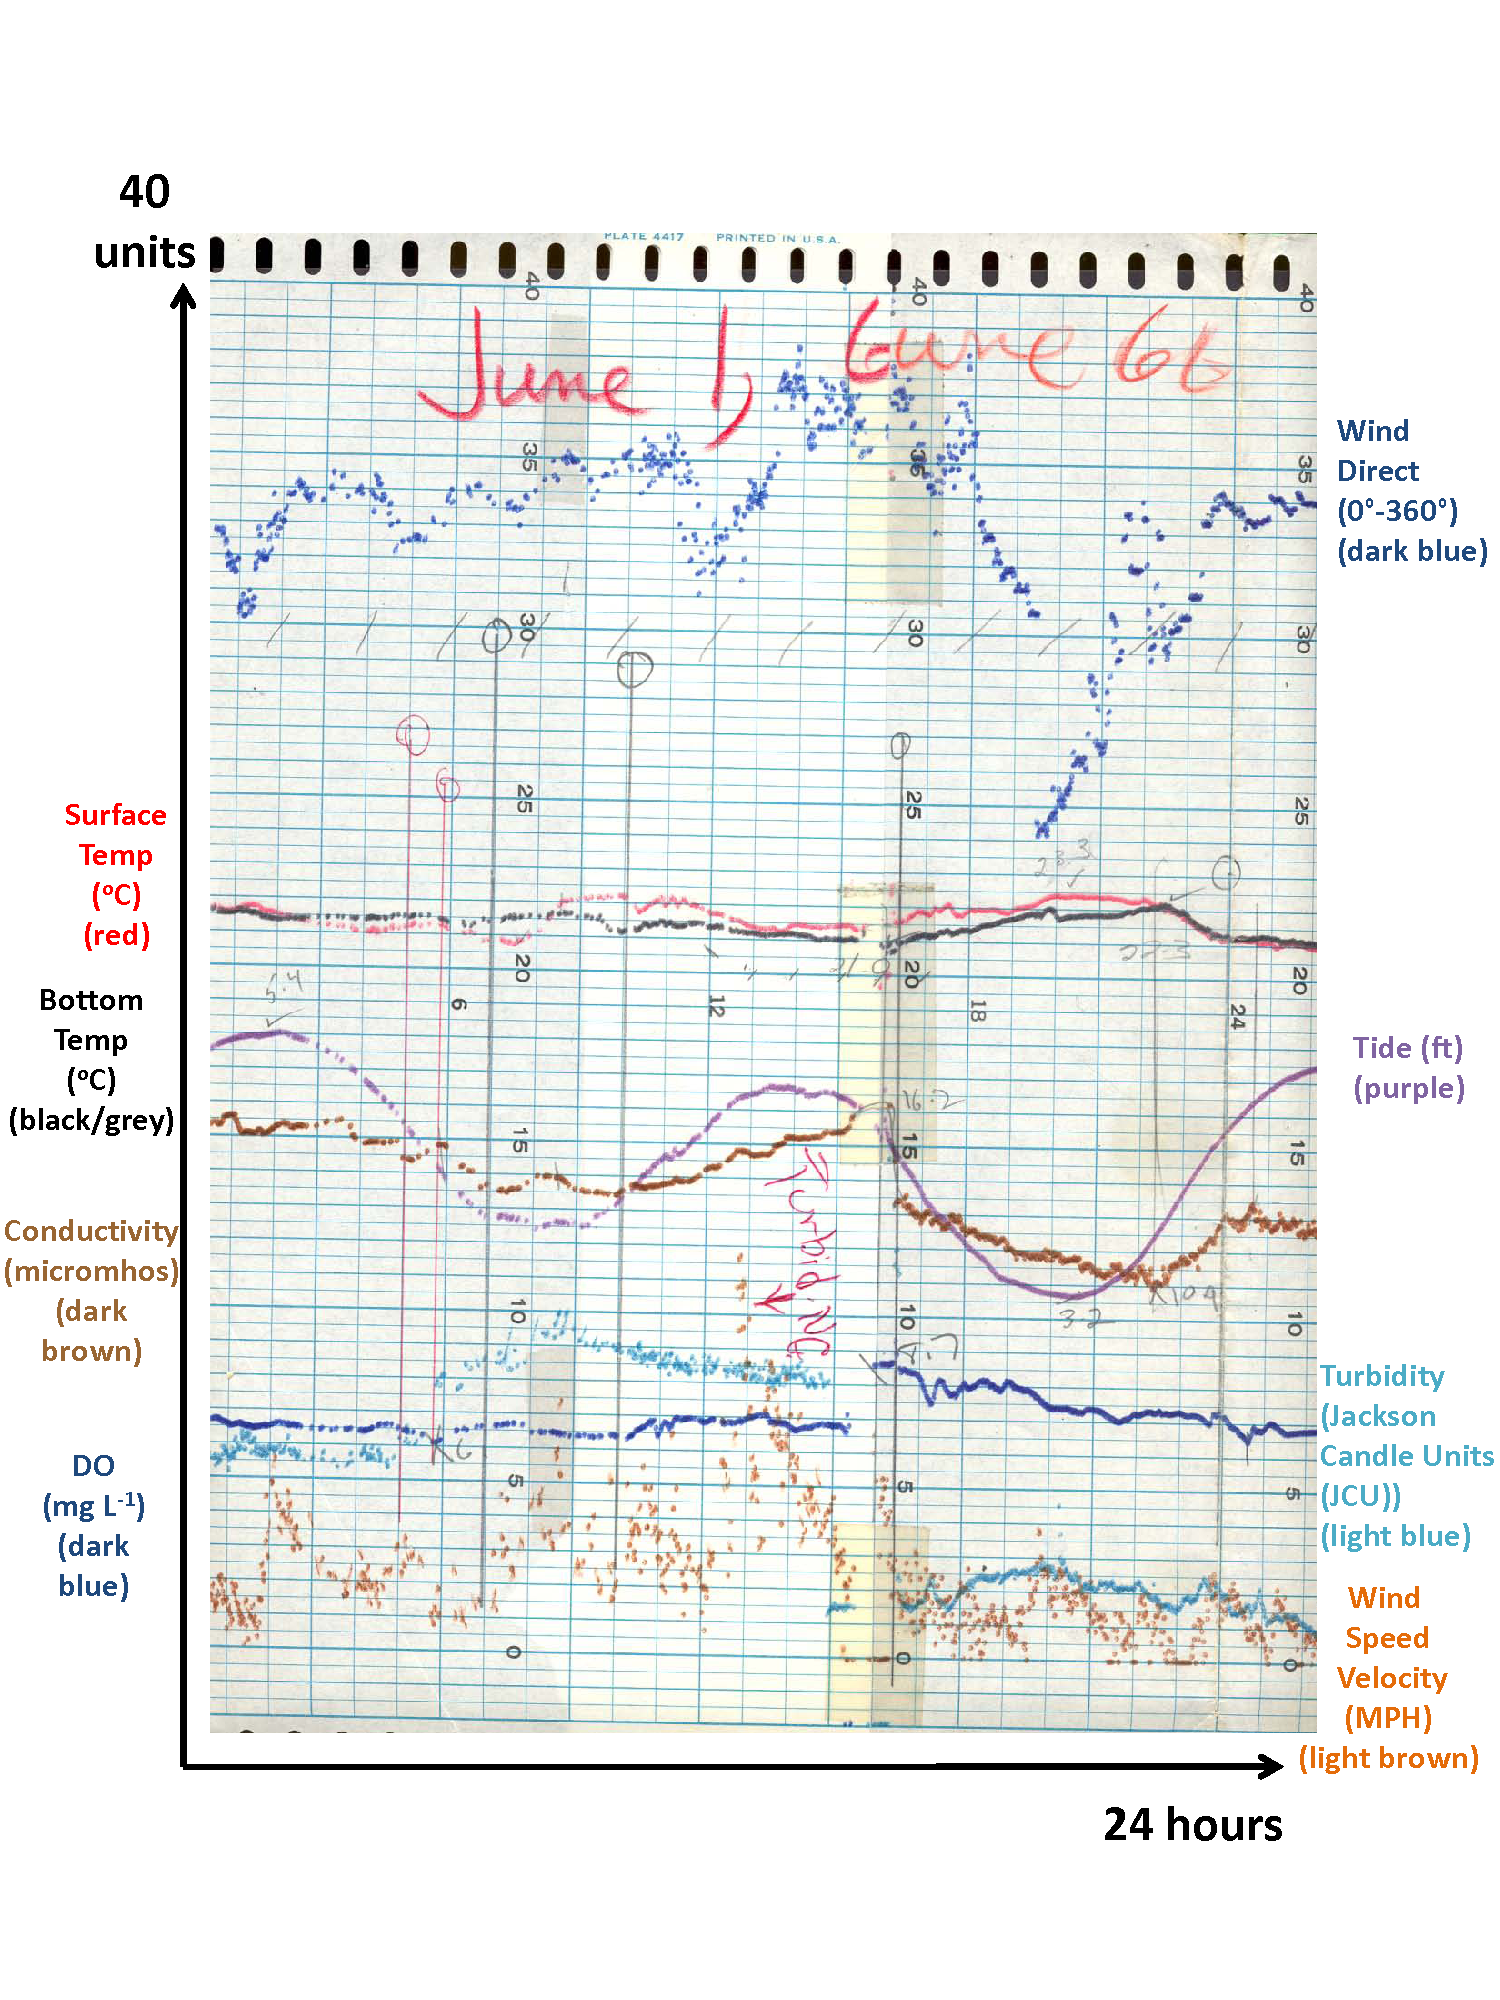
As part of efforts to monitor and understand the multiple effects of power plant operation on this low mesohaline portion of an estuary, Mihursky was able to convince the USGS to station a staff member (Mr. Robert Cory) at the Hallowing Point Laboratory for purposes of obtaining detailed records of water quality in the vicinity of the power plant. As a major part of this effort, Cory and colleagues established a monitoring station on the central platform of the MD Route 231 Bridge crossing the Patuxent several miles downstream of the power plant discharge canal. This monitoring site was equipped to measure temperature, conductivity, dissolved oxygen, turbidity, and tidal height with some data being collected in both surface and bottom waters. Data were collected using early versions of the sensor systems in use today. However, data were recorded using large format (11.5” height) strip chart recorders. In the format used by Cory, 1 cm of strip chart length was equal to one hour of time. Cory and associates managed to keep this system working from October 1963 through December, 1969 for a total of about 75 continuous months (with some short interruptions due to icing, pump and probe failures). At a scale of 1 cm of strip chart per hour, this translates to about 550 meters of strip chart output. When Cory retired from the USGS he presented one of us (WRB) with a large cardboard box holding all these strip charts. He said “I’m afraid someone will throw all these recordings into a dustbin…I hope you will use these in some useful fashion”. We have finally been able to do just that.
We believe these data to be of very good quality. Cory and colleagues were meticulous in calibrating sensors and cleaning and maintaining this very early version of a ConMon site. The strip charts are full of notes indicating calibration results as well as portions of the data stream which were in some way defective. Additionally, Cory and colleagues published a series of reports describing this system and completing some analyses of these data, mainly as they may have related to power plant operations (Cory and Nauman 1967, 1968, 1971).
Our motivation for developing an electronic version of this data set was largely based on the idea that such a data set (collected before severe eutrophication occurred in this estuarine system) could serve a very useful purpose, namely indicating what water quality conditions were like during the pre-eutrophication period. In a nutshell, they could provide us with an empirical target to aim at during the restoration process. In this particular case we also had estimates of nutrient loading rates at the fall line of the Patuxent developed by Hagy et al. (1998) and these indicated that the Cory data set started before nutrient loads were substantial but also spanned a period of increasing loads of N, P and sediments. Thus, in addition to serving as a baseline data set these data could also be examined relative to water quality changes during the early phases of eutrophication. As indicated earlier, all of the Cory strip charts have been scanned into pdf format. In addition, temperature, conductivity and dissolved oxygen in surface waters were read off the charts at one hour intervals and stored in Excel spreadsheets. Both the scanned charts and the Excel spreadsheets are available to all interested parties. Other variables recorded on the strip charts were not converted to electronic format but could be converted if there was sufficient interest.
We have also included here more recent high frequency data collected at the same site on the MD Route 231 Bridge. These data were collected using modern sondes (mainly YSI instrumentation) during 1992 (collected by Brendan Sweeney, a graduate student at CBL) and 1996, 1997 and 1998 collected by various members of our research group. Finally, the Maryland Department of Natural resources established a ConMon site at the bridge location during 2003, 2004 and 2005. This site was located at the same point as the bridge along the axis of the estuary but was located on a pier on the western shore of the river rather than on the central platform of the bridge. The sites are about 500 m apart.
Patuxent River Estuary Historical Data Set By Year